6 Essential Maps In Urban Survey:
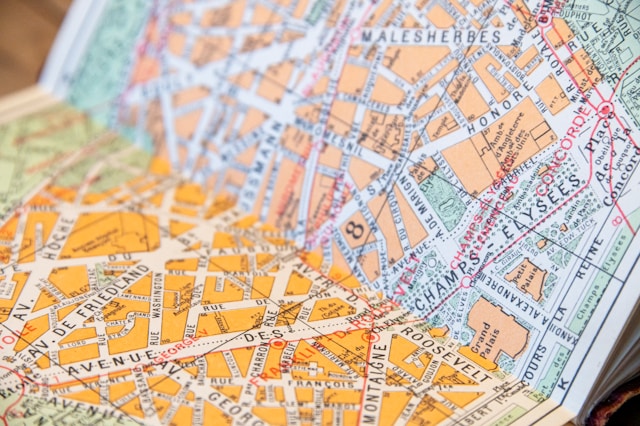
Urban surveys are the backbone of city planning and design, as they provide a structured way of documenting and analyzing the physical, social, and environmental aspects of urban areas. One of the most important tools for conducting such surveys is the use of specialized maps. These maps do not just represent geography—they reveal the relationships between people, buildings, infrastructure, and open spaces, helping planners, architects, and policymakers make informed decisions. Each type of map highlights a different layer of the city’s fabric, from land use and mobility to height regulations and ecological assets. Together, they create a comprehensive urban portrait that guides both immediate interventions and long-term planning strategies. In this article, we look at six essential types of maps that are crucial to prepare or refer to when conducting an urban survey.
1. Solid-Void Map:
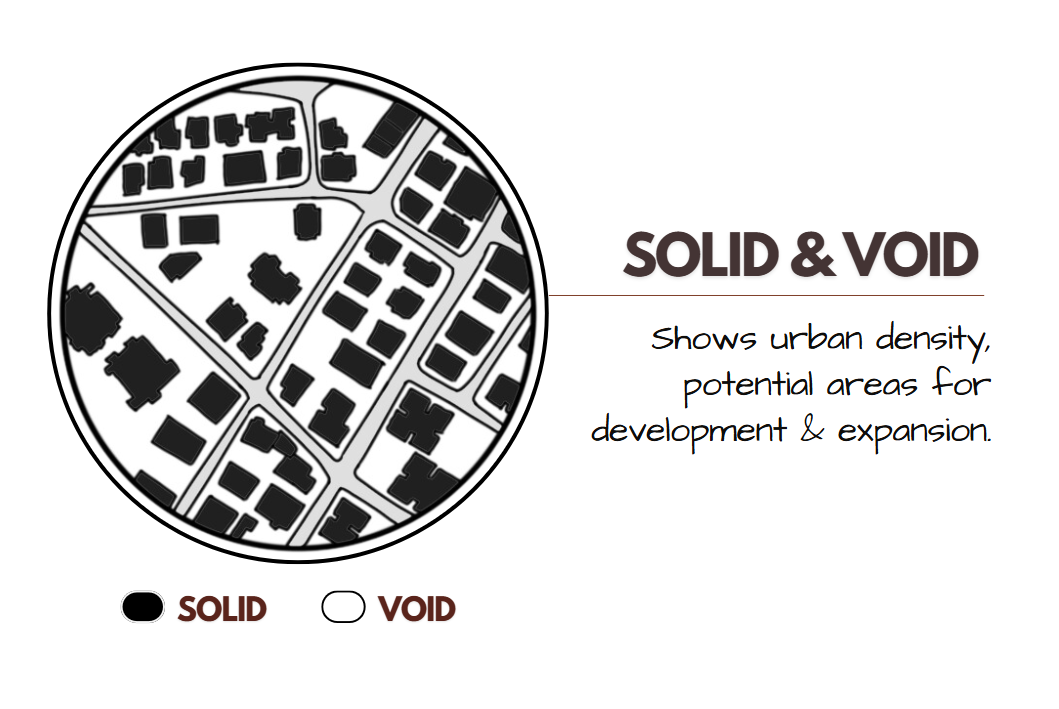
Image Credits - Shivani Chougula @Kaarwan
A solid-void map is a fundamental analytical tool that helps visualize the balance between built and open spaces within a city. In this map, the built mass (buildings) is usually represented as solid blocks while the open areas, such as streets, courtyards, and vacant lands, are depicted as voids. This simple yet powerful representation reveals the density, grain, and porosity of the urban fabric, making it possible to identify patterns of compactness or sprawl. Solid-void maps are crucial in understanding how the built environment frames public spaces and pedestrian movement, as well as how much breathing space exists within dense neighborhoods. Documenting this in an urban survey allows planners to assess the quality of open spaces, identify underutilized areas, and plan for better integration of public amenities.
2. Land Use Map:
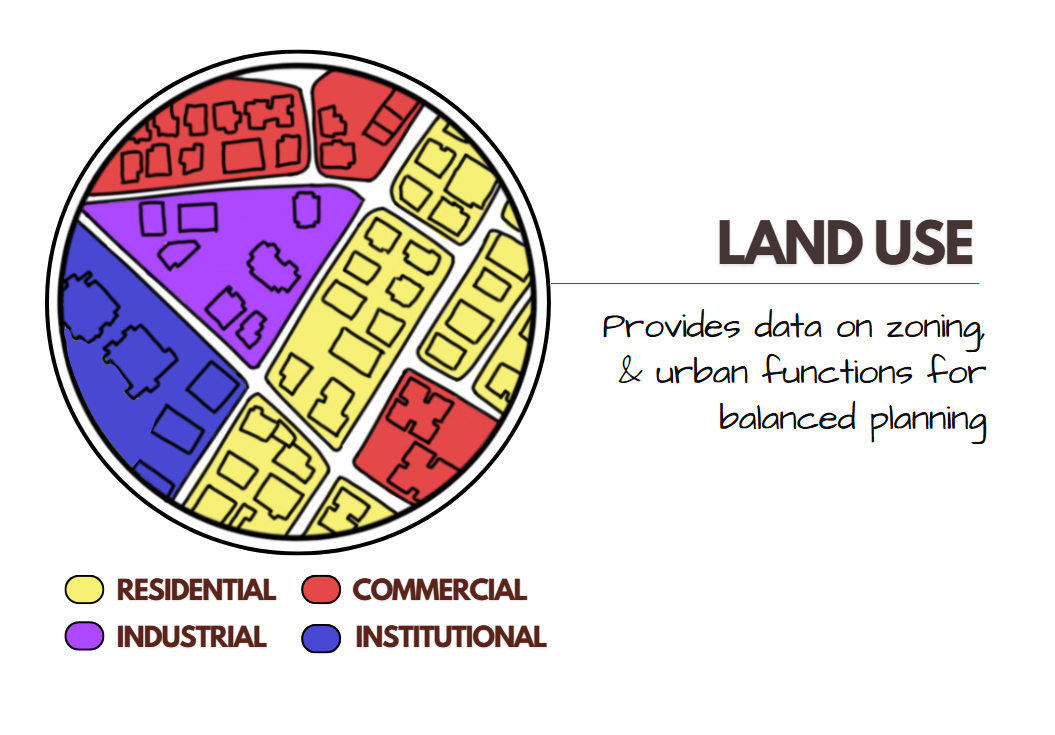
Image Credits - Shivani Chougula @Kaarwan
A land use map highlights the distribution of functions across a city—residential, commercial, industrial, institutional, and recreational zones. This type of map is vital because it directly reflects how people live, work, and interact with their surroundings. By representing zoning patterns, a land use map reveals the degree of mixed-use development or segregation of functions in a given area. Such insights are crucial for urban designers when determining whether a neighborhood has sufficient public services, or whether commercial corridors are accessible to nearby residential clusters. Documenting land use during an urban survey ensures a better understanding of urban growth patterns, prevents conflicting uses such as locating industries in close proximity to housing, and guides policies for more inclusive and balanced development.
3. Green Spaces Map:
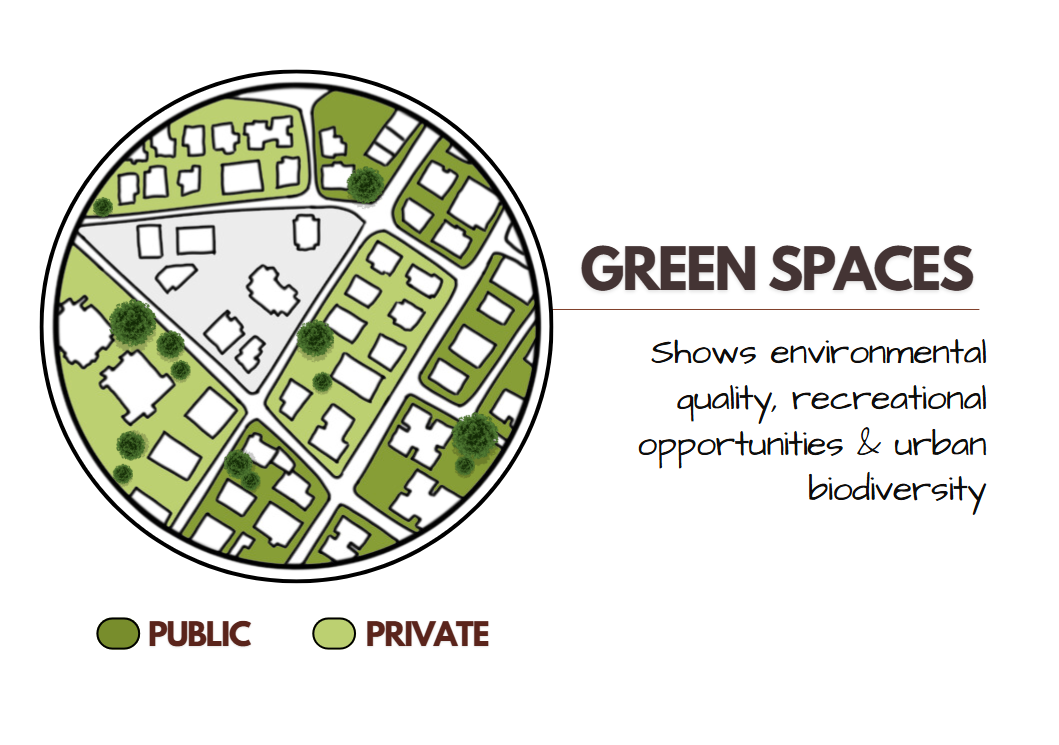
Image Credits - Shivani Chougula @Kaarwan
Green spaces play a vital role in enhancing the ecological health and livability of cities, and mapping them is key to sustainable urban planning. A green spaces map highlights the presence and extent of parks, gardens, forests, and other vegetated areas while distinguishing between public and private green assets. This allows urban designers to measure per capita green space availability, identify gaps in access, and prioritize ecological corridors or urban forestry interventions. In dense cities, where open land is scarce, green space maps are indispensable for advocating climate resilience, reducing heat islands, and ensuring the mental and physical well-being of citizens. Documenting this map during urban surveys ensures that green infrastructure is not overlooked and remains a central part of the urban development agenda.
4. Vehicular Access Map:
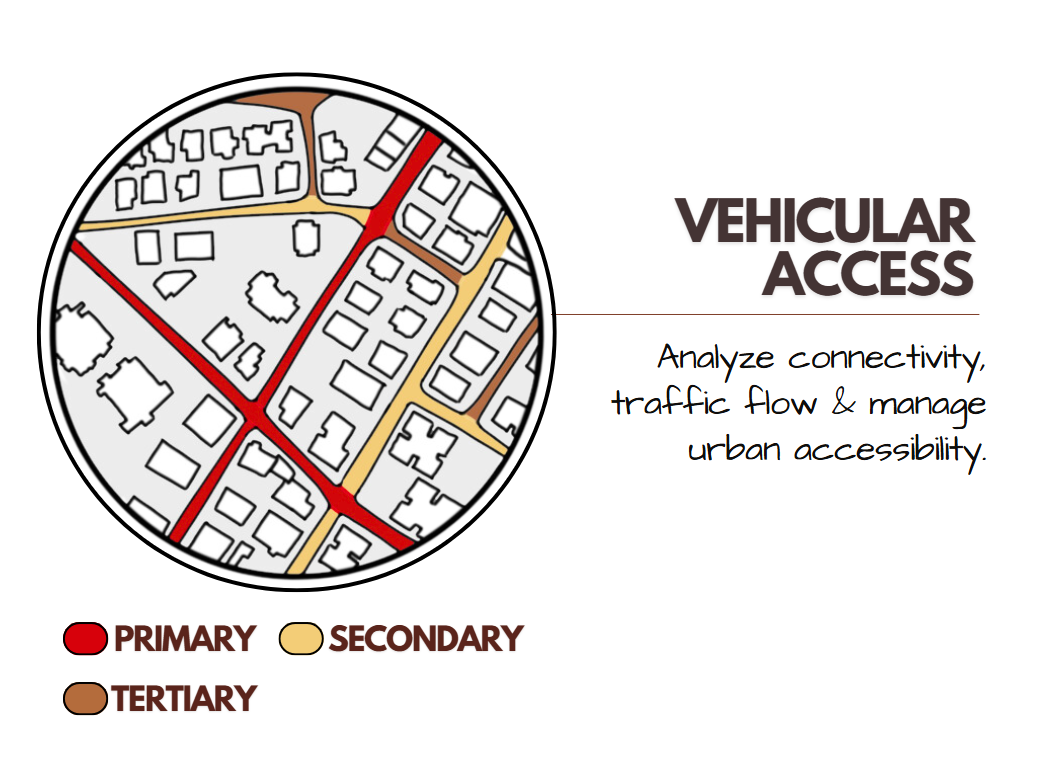
Image Credits - Shivani Chougula @Kaarwan
Mobility is the backbone of a functioning city, and a vehicular access map helps in understanding the network of roads and their hierarchy. This map categorizes streets into primary, secondary, and tertiary routes, highlighting how they connect neighborhoods and channel traffic flow. It also shows critical junctions, bottlenecks, and areas prone to congestion. In an urban survey, documenting vehicular access is crucial for assessing the efficiency of connectivity, planning for traffic management, and designing interventions such as one-way streets, parking strategies, or new road infrastructure. Such a map ensures that mobility networks support not just vehicular movement but also public transport systems, reducing dependency on private cars and contributing to a more sustainable city fabric.
5. Building Height Map:
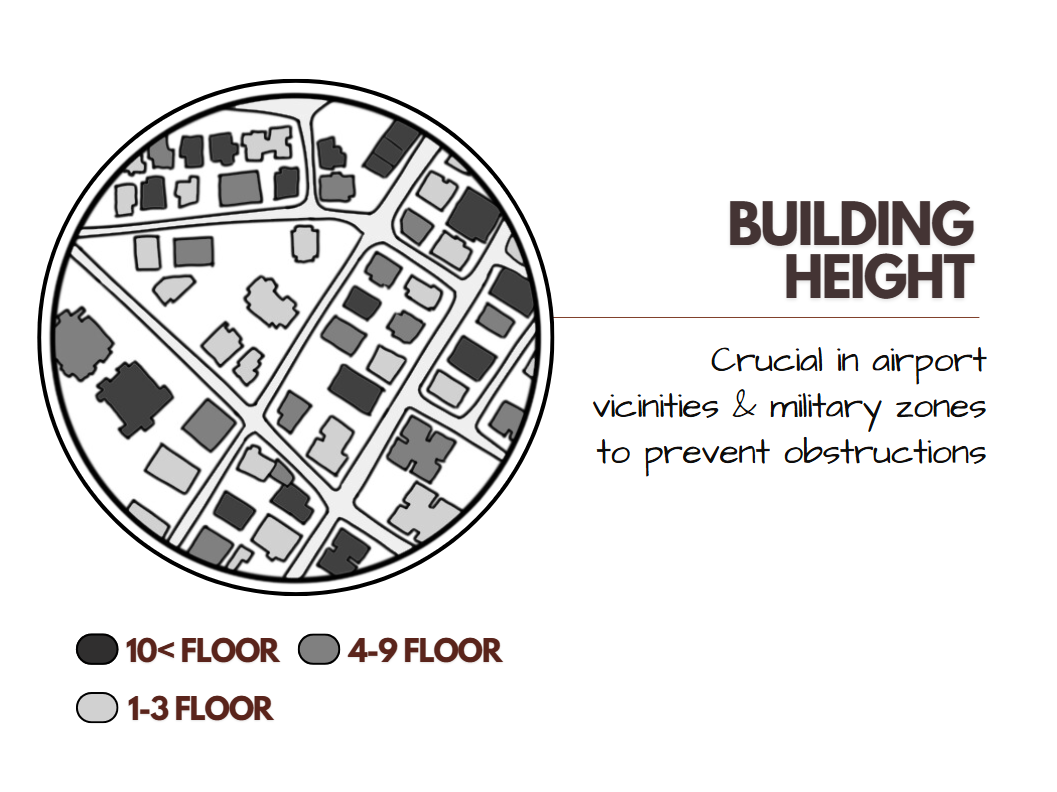
Image Credits - Shivani Chougula @Kaarwan
Vertical growth is as significant as horizontal spread in contemporary cities, and a building height map provides a clear understanding of this dimension. By zoning areas according to building heights, this map reveals the skyline and helps identify regions of uniformity or stark contrast. It plays an important role in areas near airports or military establishments where strict height restrictions apply. Beyond regulations, documenting building heights during an urban survey is also critical for urban designers when planning shadow studies, ventilation corridors, and disaster management strategies. It allows for better planning of infrastructure such as fire safety services, evacuation routes, and even the placement of telecommunication towers. A building height map ensures that urban form is both functional and compliant with safety norms.
6. Pedestrian Access Map:
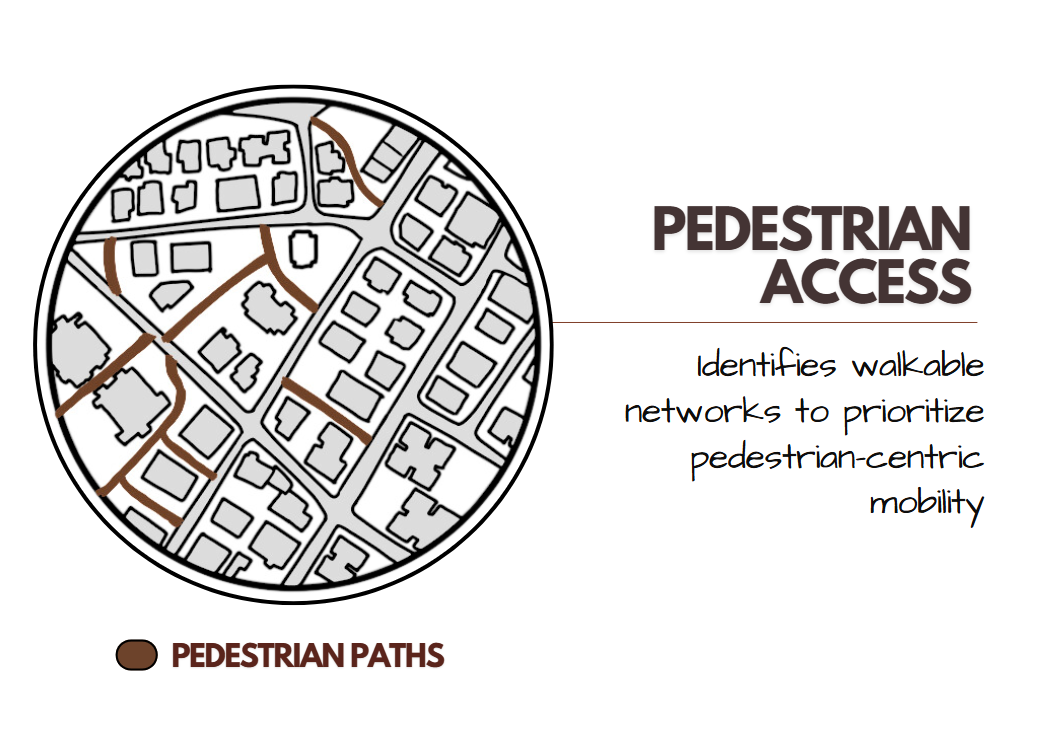
Image Credits - Shivani Chougula @Kaarwan
While vehicular mobility dominates many cities, pedestrian movement is what makes urban spaces truly livable and human-centered. A pedestrian access map highlights sidewalks, crosswalks, dedicated paths, and informal walking routes, showing how accessible and safe the city is for foot traffic. This map is especially important in understanding last-mile connectivity, which determines whether public transport is effectively integrated with residential and commercial areas. By documenting pedestrian paths during urban surveys, planners can identify areas lacking in safe walking environments, improve walkability scores, and prioritize interventions like shaded walkways, traffic calming measures, or universal accessibility features. Such maps remind us that a city is best experienced at the pedestrian scale, and ensuring connectivity is key to inclusive urban design.
Final Thoughts:
Maps are more than just representations of physical space—they are analytical instruments that help decode the complexities of urban life. From solid-void relationships that define urban form to pedestrian access networks that shape the human experience, each map adds a unique layer of understanding to an urban survey. When combined, these six maps offer a holistic picture of the city, ensuring that development is not only efficient but also sustainable, inclusive, and responsive to its inhabitants. By documenting them systematically, urban planners and architects can guide better design decisions and foster cities that balance growth with quality of life.